10 Ways Control Systems Lie
###An Introduction to Instrumentation and Control
This Presentation was delivered on behalf of the IChemE Scottish Members Group on Thursday 2nd June 2016 at Ineos Grangemouth. I have attached a copy of the slides however they are not very descriptive on their own. This post is a summary of what was delivered.
Presentation slides:
We will stick to simple instrumentation (Temperature, Pressure, Level, Flowrate), how these properties are monitored and how the information is communicated to the control system. We will not cover more advanced analysers (pH, Density, Gas Chromatography etc), any detailed electronics or control loop design aspects.
Temperature: How do you measure the temperature of your process?
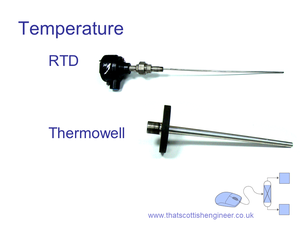
Most of the time, the temperature of the process is measured using an RTD or Resistance Temperature Detectors. These consist of a coil inside the rod. When the temperature of the coil changes, the electrical resistance changes and can be measured.
This instrument can be delicate and so to protect it, they are usually housed in a thermowell. This is a hollow tube capped at the end, which the probe slides into. This allows the probe to be removed/replaced without breaking containment.
In most cases, a 3 wire configuration is used to cancel out any effects of the leads between the coil and the transmitter head. As a result, this avoids zero and span errors and means once it leaves the factory, no further calibration is required!
Or as an Instrument Technician told me:
“They either read correct or don’t read at all”
Lie 1: Fuel oil into factory
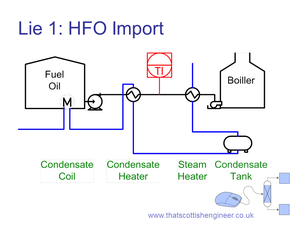
In this case, fuel oil was imported from an outside storage tank into the boiler house. For this to work, the oil needs to be pre-heated and this was carried out using a combination of waste condensate heaters outside and a final steam heater in the boiler house.
During startup, the temperature at the burner was not high enough. The Temperature reading as the oil enters the boiler house was only reading ~30°C instead of the typical ~60°C. So several technicians and managers went outside to look at the condensate heaters and try to figure out why we weren’t getting the required heat.
After several hours of looking, (and finding nothing wrong with the condensate heaters), the line into the boiler house was walked and found that the temperature probe was not sitting fully in the thermowell.
Once it was slid in fully, the temperature started reading what they expected. Turns out the condensate heaters were working fine, it was the steam heater that had a valve not fully open!
Pressure: How does the transmitter get info to control room
In this example we focus on how the plant condition is transmitted from the main process into the control system.
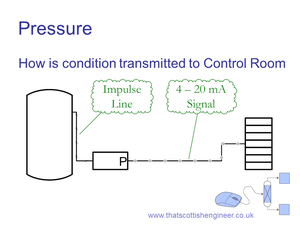
Impulse lines are small tubing used to link the process to the transmitter. There is no flow through these lines, they only transfer the pressure. Sometimes they can be filled with a specific medium to keep the process fluid out of the line and avoid freezing/blockages.
The reason impulse lines are used (rather than just putting the transmitter directly on the process equipment) is often to allow easier access to maintain the transmitter. They also allow measuring differential pressures between two different points of the process.
The standard way to transfer the reading between field instruments and the control system using a 4-20mA signal. 4mA corresponds to the low end of the range (usually 0) and 20mA corresponds to 100% of the range.
Electrical current rather than voltage is used because this negates the effect of line length of the signal wires. Think current as flowrate and voltage as pressure. The pressure would drop as the length of pipe increases where as the flow would remain the same.
Lie 2: Wrong instrument range
For this to work, both the transmitter and the control system need to agree on what 0% (4mA) and 100% (20mA) mean. If a transmitter is replaced with the wrong range and now reads 0-30 barg while the control system still operates using the old range of 0-25 barg, you could find yourself operating above the operating envelope without knowing it!
Level: How hard can it be to tell me how full my tank is?
Several different methods that can be used to measure a level in a vessel.
We will cover:
- Differential Pressure
- Radar
- Magnetic Followers
Level: Differential Pressure
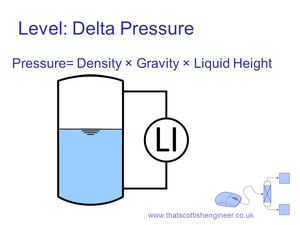
One of the most common methods used to measure a level is to measure the pressure at the bottom of the tank and compare this with the pressure at the top of the tank (Differential Pressure or DP).
Once you know the pressure difference you use good old P = ρgh
Rearranged to give: Height of liquid = Pressure difference / (density * gravity)
- Pressure difference we have just measured
- gravity is known
- Density of our fluid is known*
* or is it?
BONUS NOT COVERED IN THE PRESENTATION: A bubbler is used to measure the level in an atmospheric tank. The tank is open to atmosphere so there is no need to measure the pressure at the top of the tank, just measure the pressure required to trickle in a small flow of instrument air (that causes a small stream of bubbles - bubbler) into the tank. This means the instruments can be stored remotely from the tank and linked using impulse tubing.
Lie 3: Sugar factory shutdown.
Here is a paraphrased radio conversation that occurred in a sugar factory while the plant was in the process of shutting down:
Outside Operator: Control room, your tank is overflowing
Control Room: But it is only sitting at 85%
Outside Operator: I am going to need a life raft soon.
This level control instrument that had operated reliably for the previous six months was now significantly under reporting the level.
During normal operation a tank operates with ~15% sugar in water. As part of the shutdown process, water is circulated slowly removing all the sugar till there is less than 1% sugar.
As a result, the density of the liquid in the tank is much lower at startup and shutdown and so the tank level looked lower than it actually was.
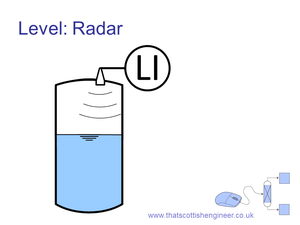
Level: Radar
Make use of radar to bounce radio signal off liquid level and back to detector. In this case it does not matter if the density changes.
What could go wrong? (Hover the mouse over or click the image to see)
Lie 4: Foam!
The presence of foam in the tank can give a false high reading within the tank.
This is a serious safety concern because the control system would act in a way to empty the tank and this could lead to a high pressure gas breakthrough. Unlike in the image, it is usually impossible to know if the high reading is actually a high level or foam making diagnosis difficult.
Similarly, radar can be confused with spray or sloshing within the vessel.
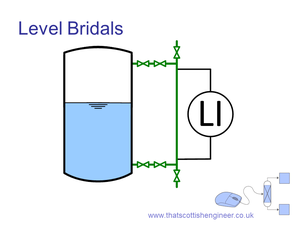
Level Bridal
To avoid foaming/spray, and improve isolation for maintenance, the level instruments are often connected to a stand pipe or bridal.
There may be multiple instruments attached to the same bridal and possibly of different types.
One thing to note: Just because an instrument reads a level of 90%, does not mean that the tank is actually at 90% of the full height, just the 90% of the range of that instrument. The span of the bridal may not be the full height of the tank.
Lie 5: Crud blocking lines
Even on the cleanest of duties, it is still possible to get debris collecting within the process. One of the dangers of using a bridal is that there may be a blockage at one (usually the lower) tapping.
If the tapping is fully blocked, the level will stop varying and just read steady and the vessel will eventually fill or empty completely.
If the tapping gets a partial chock, the level will still respond but slower than that of the actual vessel, leading to possible undetected excursions.
BONUS Magnetic Follower
BONUS NOT COVERED IN THE PRESENTATION:
A magnetic follower is a float with a magnet on it sitting inside a stand pipe. Sensors outside the standpipe detect when the magnet passes, allowing the level to be read. These often have a visual aid in the form of magnetic strips that rotate, showing a different colour. This allows the level to be read locally without the need for a glass gauge.
- Doesn’t matter what the density is*
- Doesn’t matter if there is foam **
* as long as the density is higher than that of the float’s
** as long as the foam density is lower than the float’s
Flowmeters
Like level measurement, there are several different ways a flowrate could be measured.
- Orifice plate/DP
- Vortex meters
- Coriolis meters
- Mag flows
- Ultrasonic
Orifice plates
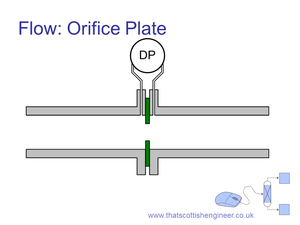
Orifice Plate Flowmeters are probably the most commonly used flowmeter. A thin plate with a hole smaller than that of the pipe it is sitting in.
As the flow through the orifice increases, the pressure difference across the orifice will also increase. The flowrate can therefore be obtained using the equation below:
Q = C √(2*ΔP/ρ)
- Q is the volumetric flowrate
- C is a system constant
- ΔP is the measured pressure difference across the orifice
- ρ is the fluid density
Note once again if the density of the process varies, it can lead to false readings.
The key thing to note here is that unlike with the level measurement, the flow does not vary in a linear way. Instead, it is the square root of the differential pressure that needs to be multiplied by the factor to get the final flowrate.
Traditionally the instrumentation in the field was not capable of performing the square rooting and so the raw differential pressure signal was sent back to the control system, and it was the control system that had to do the square rooting. Now with more modern transmitters, it is possible to do the square root calculation either in the field or in the control system.
Lie 6: Where is the square rooting done?
Generally speaking, it doesn’t make much of a difference where the square root calculation is done, just that it gets done once (and only once).
Does it matter where the calculation is done?
The only time it will have an effect is when operating at low flowrates, due to the shape of the square root curve, noise which ordinarily would not have much impact on the interpreted flowrate can be amplified when the main signal is low and then gets square rooted.
As such it is preferable to carry out the square root function in the field and transmitting a linear signal back to the control system.
Vortex meters
Vortex flow meters make use of the vortex shedding phenomena caused when fluid passes a bluff body. This leads to vortices being formed at the downstream side of the body. Periodically a vortex will shed from alternate sides (as shown in the animation).
The frequency of the shedding is directly proportional to the velocity of the fluid and so the volumetric flowrate can be calculated from this.
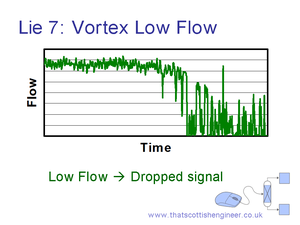
Lie 7: Vortex reading drops off at low flows
One thing I have noticed with low vortex meters is that unlike DP Flowmeters which may get a bit noisy at low flowrates, vortex meters tends to drop the signal completely. As can be seen in the graph, as the flow decreases, there are times the flowrate reading drops to zero.
This is not what is actually happening in the pipe, it is just that the time between the vortex shedding occurring is getting great enough that the flowmeter struggles to detect it above background noise.
In cases like this, it is impossible to use this kind of a flow for flowrate control and makes carrying out a mass balance extremely difficult.
Coriolis meters
Images by Cleonis (Own work) CC BY-SA 2.5, via Wikimedia Commons
Coriolis meters are different from the previous mentioned meters in that they measure a mass flow (eg Kg/hr) rather than a volumetric flow (eg m³/hr).
The animations (from wikipedia) show how Coriolis Mass Flow meters work. The fluid is passed through two parallel tubes and an actuator (not shown) induces a small vibration of the tubes.
When no fluid is flowing, the vibration of the two tubes is symmetrical, as shown in the first animation. When there is mass flow, there is some twisting of the tubes as shown in the second animation.
The inlet arm and the outlet arm vibrate with the same frequency, but the vibrations are out of sync when there is mass flow. The degree of phase-shift is a measure for the amount of mass that is flowing through the tubes.
Update Here is a video from Ermison on How do Coriolis Meters work
Not-a-lie: Blocked Pam oil flow.
A point to note about the Coriolis Meter is that the U-shaped flow can be difficult to clean. This became particularly noticeable when used as part of a Pam oil metering system.
Under normal circumstances, the oil remains hot and runs through a lagged and trace heated line without any problems. Then a blockage developed downstream and the flow stopped. By the time the initial blockage was cleared, the rest of the line had started to cool.
The trace heating kept most of the line in the liquid phase, unfortunately the trace heating was not as effective at the Coriolis Meter and the fluid in the U-bend set solid.
This example is not included as part of the main number because control system tells you what has happened. Doesn’t help you unblock it though!
Mag flow
Magnetic flow meter (or Mag Flow) is very common outside petrochemical processes. A magnetic field is applied to the pipe which results in an electrical potential over the width of the pipe that is proportional to the velocity through the pipe.
For a magflow to work, the fluid must conduct electricity (ie water), as such they have limited use in primarily petrochemical processes.
Ultrasonic
Ultrasonic flowmeters make use of the Doppler effect to measure the velocity of the fluid. An audio signal is sent upstream and downstream through the liquid and the difference in time that the two signals take is used to infer the velocity.
Ultrasonic flow meters are affected by the acoustic properties of the fluid and are sensitive to density and temperature changes. They also struggle with any form of two phase flow such as suspended particulates and can give erroneous readings.
Control valves
So far we have covered simple instrumentation, how the process is measured and transmitted back to the control system. We will now cover how signals from the control system are transmitted to valves in the field.
The signal for the valve output (0-100%) is sent using the 4 to 20mA signal the same as for the inputs. This is then used by the valve controller to adjust the pressure of instrument air on the actuator to get the required valve position.
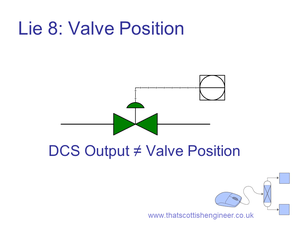
Lie 8: Control System output does not equal valve position!
Just because the control system is asking for an output of 10%, does not mean that the valve will necessary actually go to 10%. Instead the local controller will attempt to move the valve by adjusting the instrument air to the amount it thinks it needs.
There are many reasons this might not actually mean 10%, the valve could get stuck, there may be an offset (so valve output needs to be more than say 5% before it starts to move) or the local instrument air supply may be a lower pressure.
Many of these problems can be avoided if the control valve is fitted with a Smart positioner (also know as a Digital Valve Controller or DVC).
In this case, the DVC will take into account the actual position of the valve, then adjust the instrument air supply as required to get the valve to the correct location.
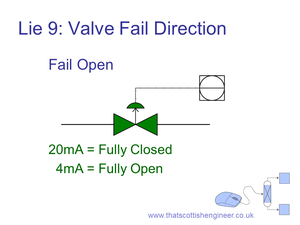
Lie 9: Fail open vs Fail closed
In most cases, valves tend to be fail closed. That is, if the instrument air supply or the signal is lost, the spring loading of the valve will move the valve to the closed position.
When this is the case, then the 4 to 20mA signal operates as expected, 4mA refers to 0% open and 20mA is 100% open.
If however the valve is a fail open valve, then the signal is reversed, 4mA is the fully open position and 20mA is fully closed.
This can cause much confusion and care must be taken to ensure the control system is configured correctly. Generally the control system is setup such that it will always display 100% as valve open and the signal is inverted behind the scenes.
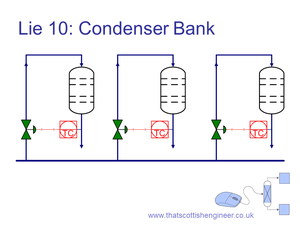
Lie 10: Sugar factory condensers
The final example covers a bank of condensers used as part of a vacuum system. Cooling water is directly contacted with the water vapour stream, which collapses the water vapour and causes the vacuum.
The flow of water is adjusted to maintain a set outlet temperature from the condenser. If the temperature is too high this will lead to a poor vacuum and so the cooling water flowrate is increased.
About 12 hours into a startup, the vacuum system was struggling to maintain pressure. The temperature from one of the condensers was about 10°C too high and in alarm.
The outside plant was checked:
- The temperature probe was correctly reading the water temperature (this was checked with a local temperature gun).
- The instrument ranges were the same and had not been changed.
- The valve was genuinely open 100%, the outside operator could feel the vibration of the water flowing through the pipework.
- The valve was fail closed and the control system was set up correctly to reflect this.
In this case, the problem was not caused by the controller that was in alarm, but one of the other condensers. The other condenser was operating with a very low temperature (but there was no low temperature alarm because low temperatures do not cause any problems with the process) and the control valve was sitting at 0%.
It turns out that although the control system thought the valve was closed, during the shutdown period, the actuator on the butterfly valve had been removed and replaced. When it was replaced, the actuator was put back on 90° out from where it should have been. As a result, even though the actuator was supposed to be fail closed, the installation method had turned it into fail open and this condenser was robbing all the water from the cooling water header!
Summary
So to summarise:
- Don’t believe everything you see on the screen
- Physically view the plant
- Understand what is actually being measured
- Take extra care during startup and shutdown situations

10 Ways Control Systems Lie by Alistair Marshall is licensed under a Creative Commons Attribution 4.0 International License.

