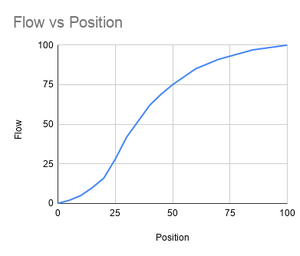
When a control valve opens, the flow through it increases. But the increase in flow is not necessarily linear, the rate of change in flow may be different depending on how far open the valve already is.
If the flow through a valve was linear, every time the valve opens 1% further, the flow would also increase by 1% of the maximum flow. When the valve is 50% open, you would expect the flow through the valve to be half of the maximum flow.
In practice this does not happen. If a good valve is picked for the job, then the difference will be quite small and probably wouldn't cause much of a problem. But in some cases, the differences can be quite large. Below is a graph of a butterfly valve which is a particularly non-linear valve. Initially the valve doesn’t allow a lot of flow, then after about 10%, the flow increases rapidly. By the time the valve is 50% open, the flow is already at 75% of the full flow. Then the remaining 50% of the valve only slowly increases the flow.
So why is this a problem?
Most of the control systems assume that everything is linear. They assume that how things worked at one end of the range, will be the same at the other end of the range. If you think about it, the system effectively learns that “I am 5 units too high, I need to close the valve by 2% to get me back to the correct place”. But if the system is at a different part of the curve, that 2% will not have the same effect.
To get around this, we can add output characterisation. This is when the output of the controller is adjusted before getting sent to the valve. In the case of the butterfly valve above, moves in the 10 to 75% section of the controller would be made smaller, while outside this region would be made larger. This cancels out the non-linearities of the valve, allowing good control over the full range.
Go Top« Forrest School
Smartphones = Cigarettes »


Comments
I would love to know what you think. To comment on this article, send me an email
No comments yet.